Stephanie Hoglund

5 years of data analytics experience in the automotive and defense industries.
Go Blue!
View My LinkedIn Profile
View My Github
Analytics Projects
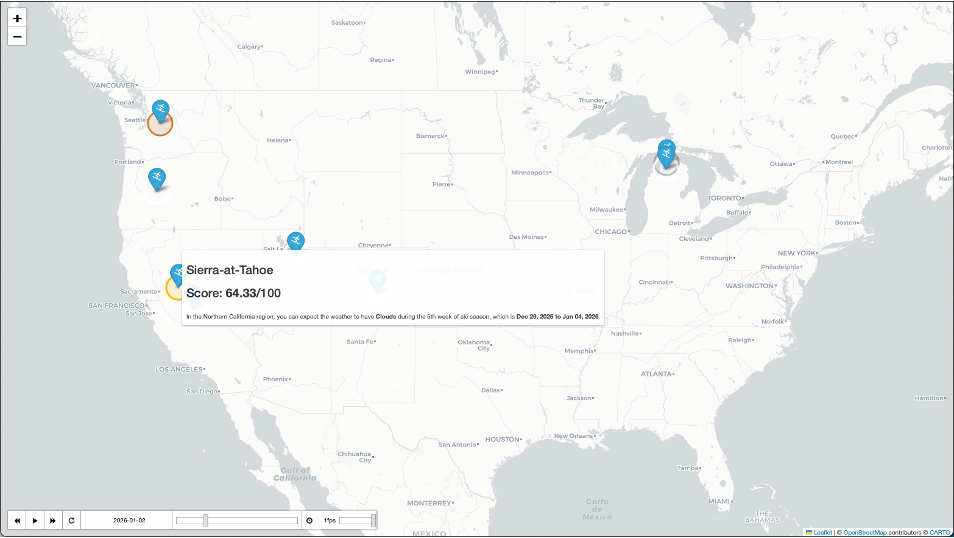
Forecasting Weather Patterns for Optimal Skiing Conditions
I’ve skiied since I was four years old and I now can go on ski trips with friends since we all have steady incomes now. However, it’s always random where we want to ski and when… but what if it doesn’t have to be? I built a tool that calls multiple APIs to aggregate historical weather details for U.S. ski resorts to predict future conditions and subjectively rated them based on skiing preferences. I wanted to get more experience with APIs and streaming data, so I simulated Spark Streaming using Azure Event Hubs and Databricks. I also developed an interactive chart that showcases the top 3 mountains (think gold, silver, bronze rating like the Olympics) to ski during different weeks of ski season (December to mid April).
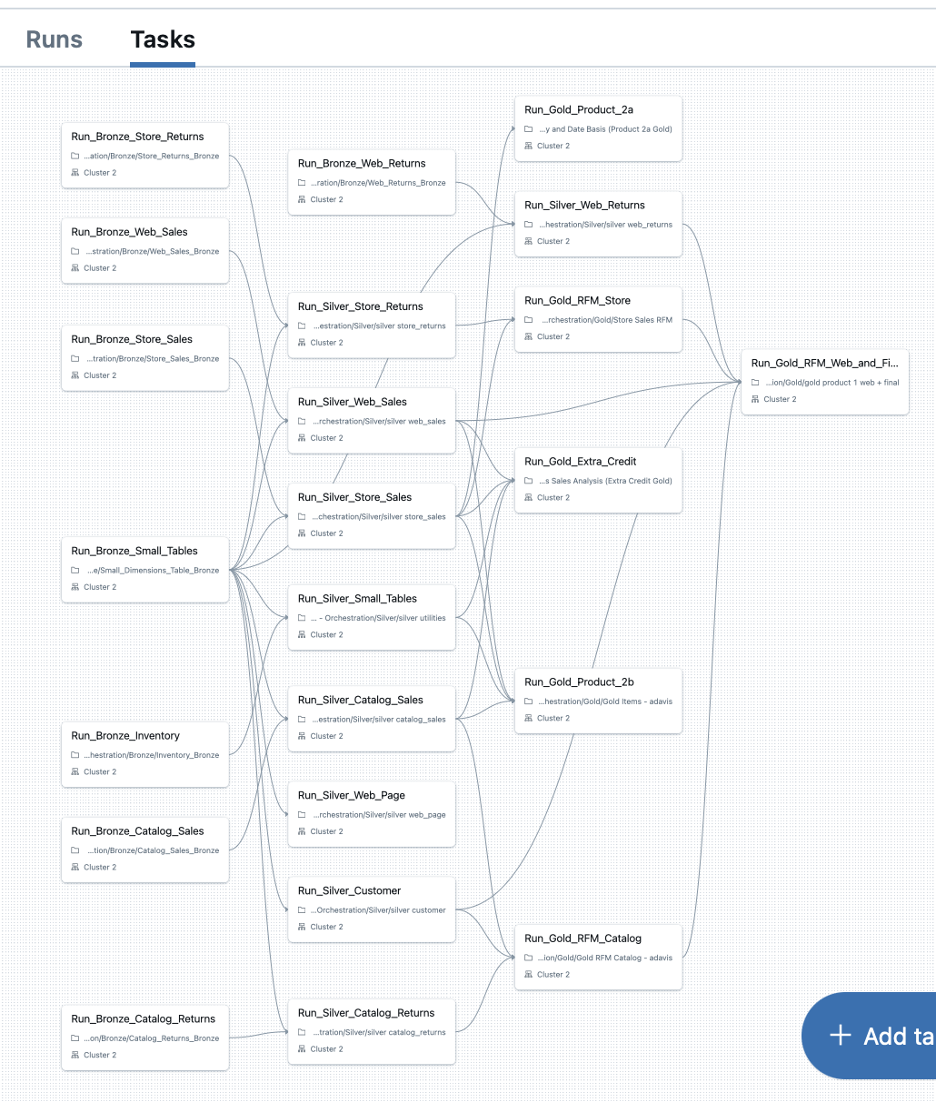
Big Data Technologies Capstone Project
Demonstrated medallion data architecture and pipeline orchestration in Azure Databricks to combine and clean data for RFM analysis to assign “value” to a customer based on their transaction history.
Financial Fraud Detection
Identifying anomalous transactions across merchants using machine learning and statistics. Generated reproducible, automated HTML reports to query SQLite databases and present suspicious activities. More recently rolled up my sleeves to handle the data ingestion piece that feeds into said report that’s briefed quarterly to senior stakeholders. Due to the success of this project, client has requested follow-on work to investigate fraud in another sector. Became a solutions architect to lead the pipeline development using Python and AWS.
Demand Forecasting of Cooking Classes
Exploring the trends in cooking class fill rates through feature engineering and hypothesis testing for future models as a former chef’s assistant.
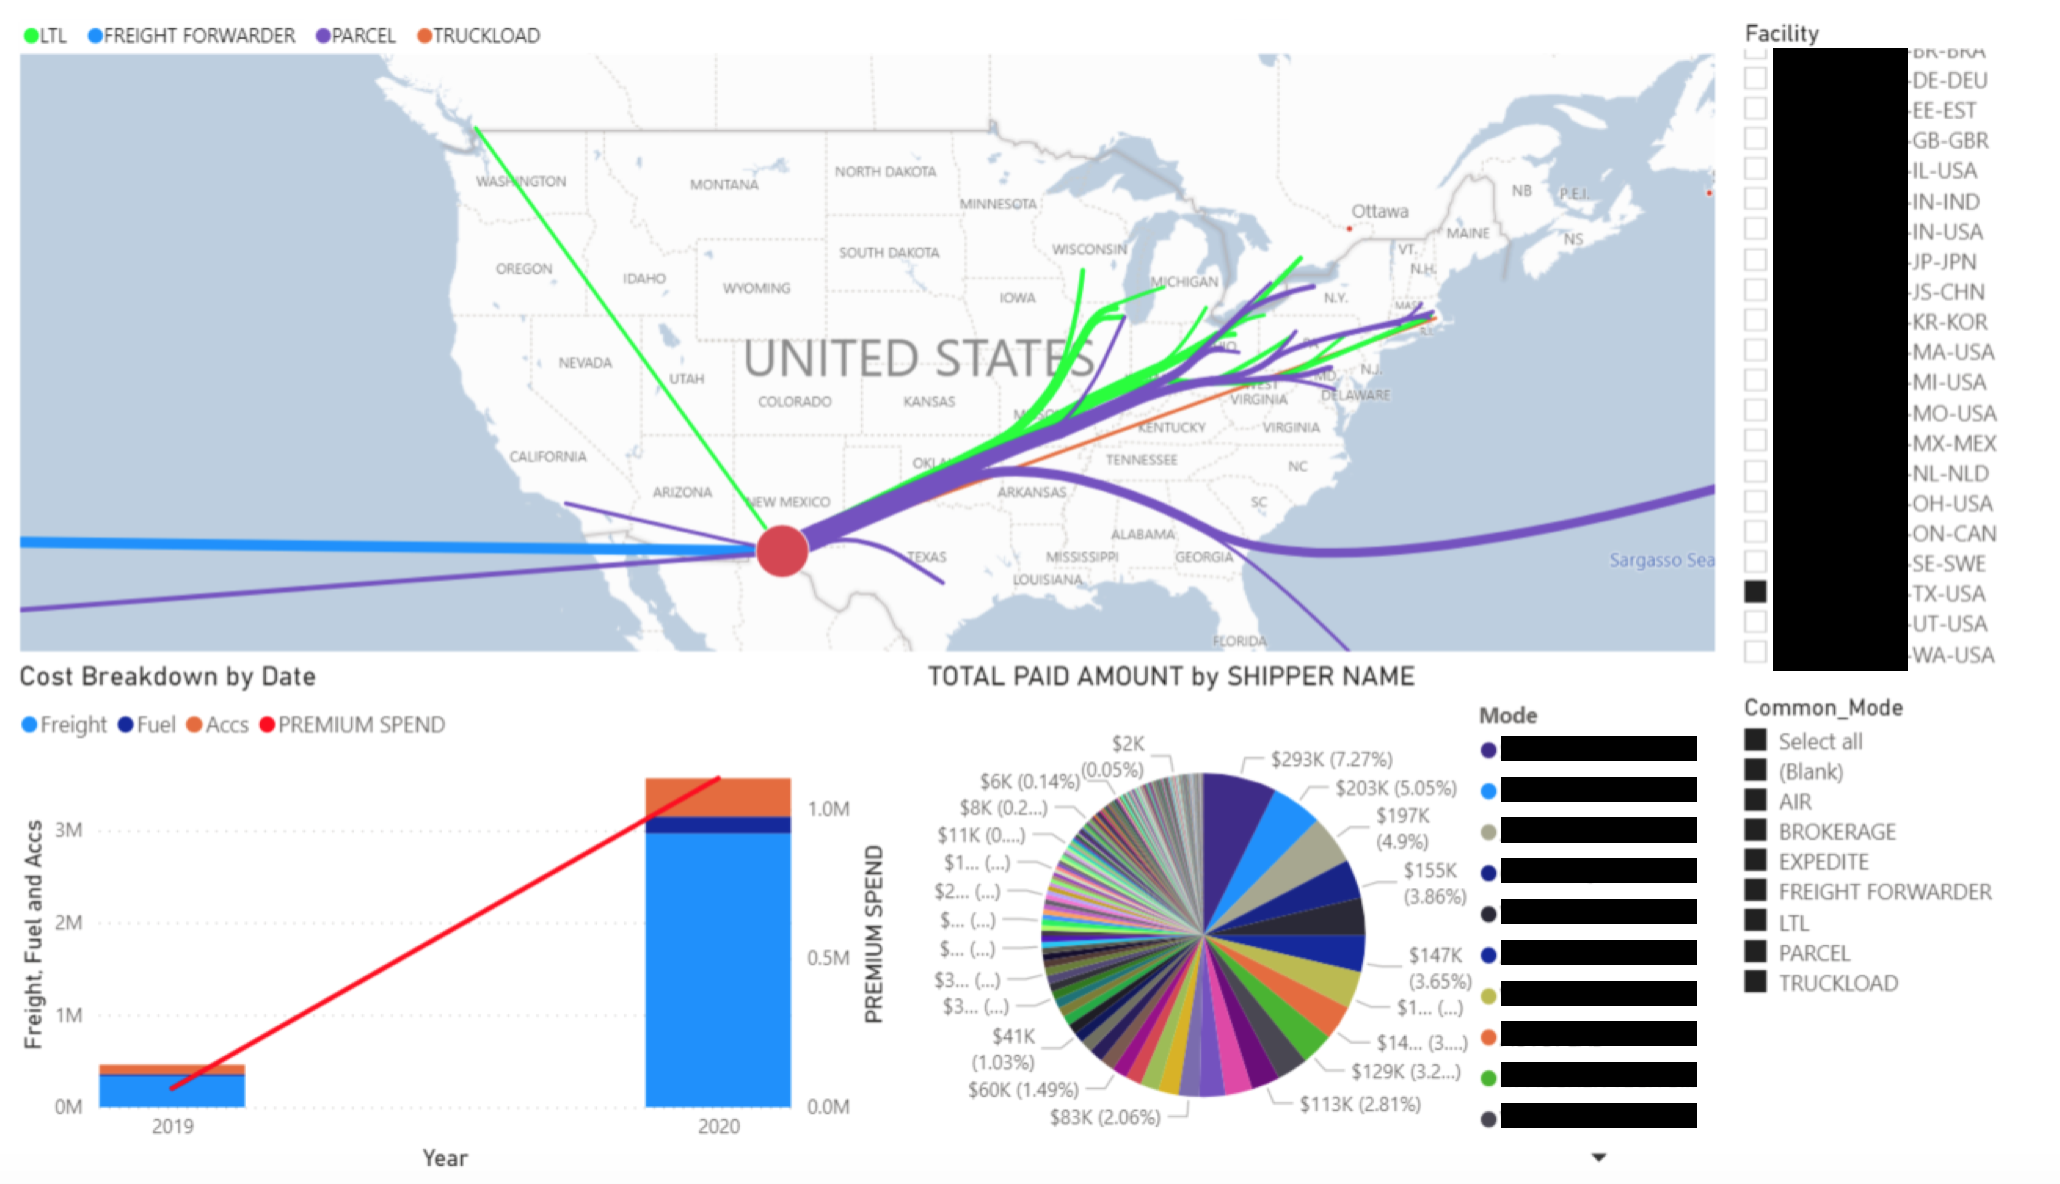
Supplier Network Map for Global Logistics at Tier 1 Automotive Supplier
Developed global supply map to highlight profitable and high-trafficked shipping routes for cost-improvement projects. Created dashboard to see incoming shipments on a per-shipper basis for demand planners.
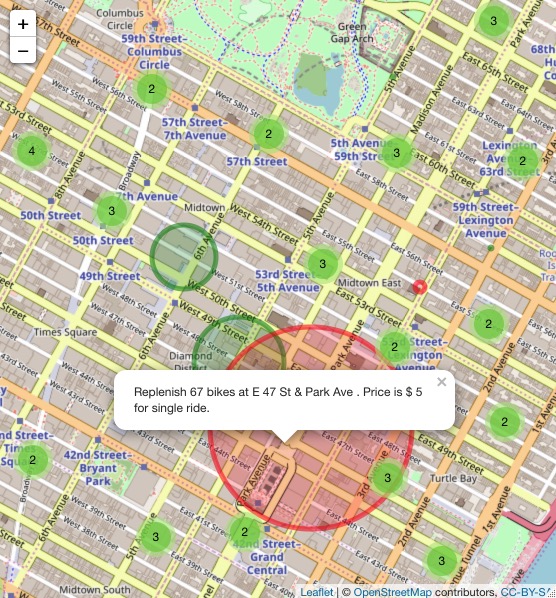
Visualizing Bike Patterns + Modifying Pricing Strategy for Citi Bike
The goal is to increase revenue and decrease bike shortages at stations across Manhattan. Developed interactive map using Leaflet to highlight asymmetric traffic routes and stock levels in real-time. Created pricing scheme recommendation based on the stock level amount in a quantile function.
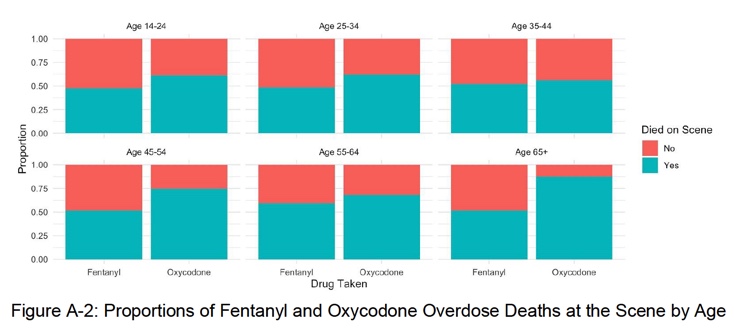
Hypothesis Testing on Opioid Overdoses to Advocate for Narcan Usage
Narcan can be a life-saving medicine to rapidly reverse an opioid overdose in emergency situations. According to the NHTSA, roughly 50% of EMS agencies run at the Basic Life Support level and cannot legally administer intravenous drugs, which includes Narcan. In this project, I wanted to investigate how quickly a patient can die from exposure to fentanyl versus oxycodone with additional analysess considering confounding variables of age and race.
Visualizing the Part Approval Process
The additive manufacturing process features multiple stages of rigorous approvals and milestones each engineer must follow to vet a part. A suite of dashboards were created for senior leadership to monitor this process for 1,000+ parts: see how many parts are in each stage over time, where bottlenecks occur in the sub-processes, how well engineers performed, etc.
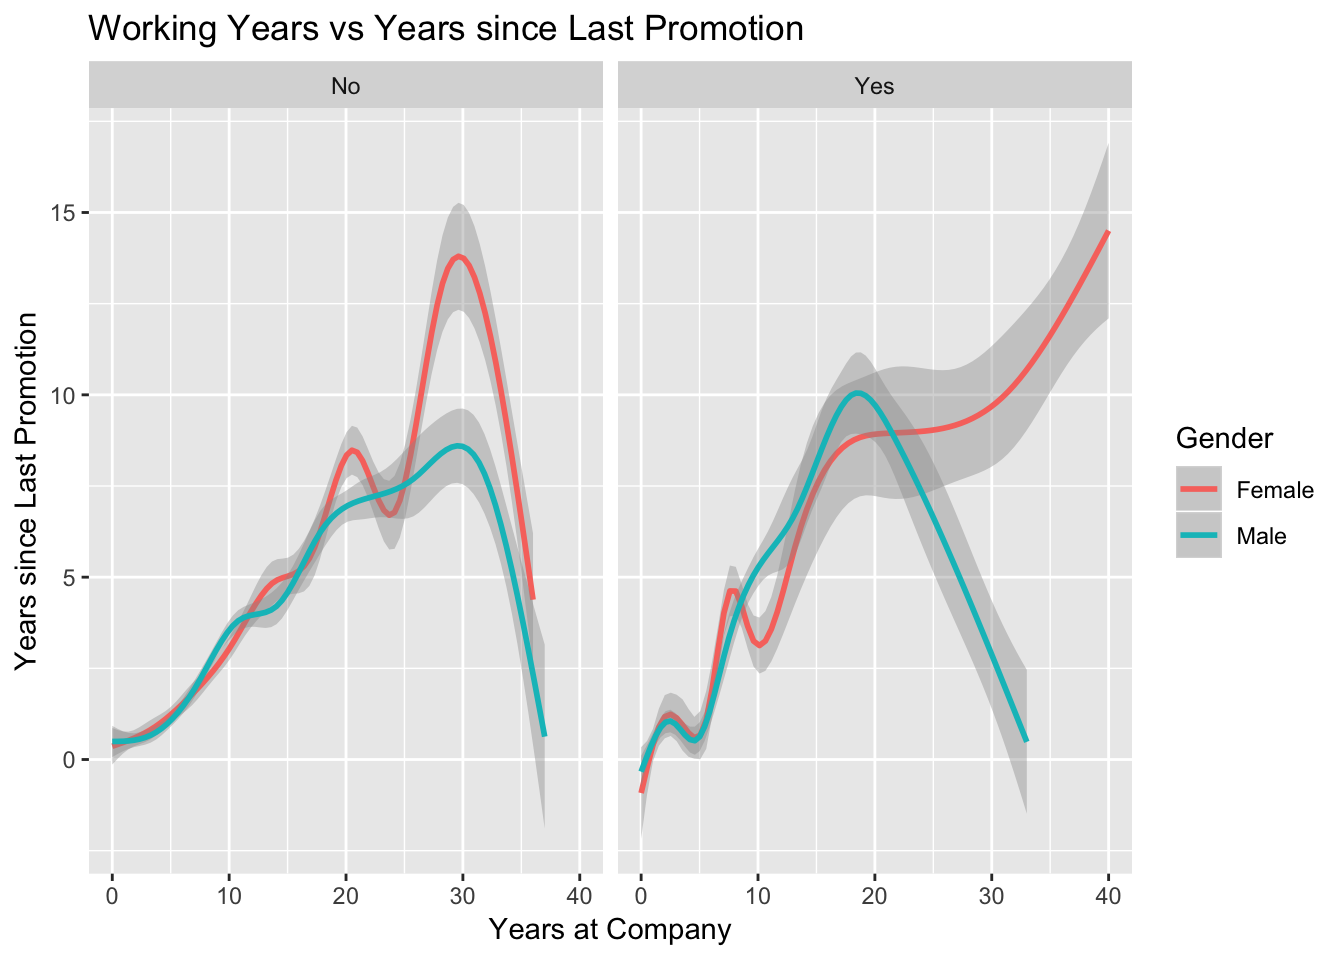
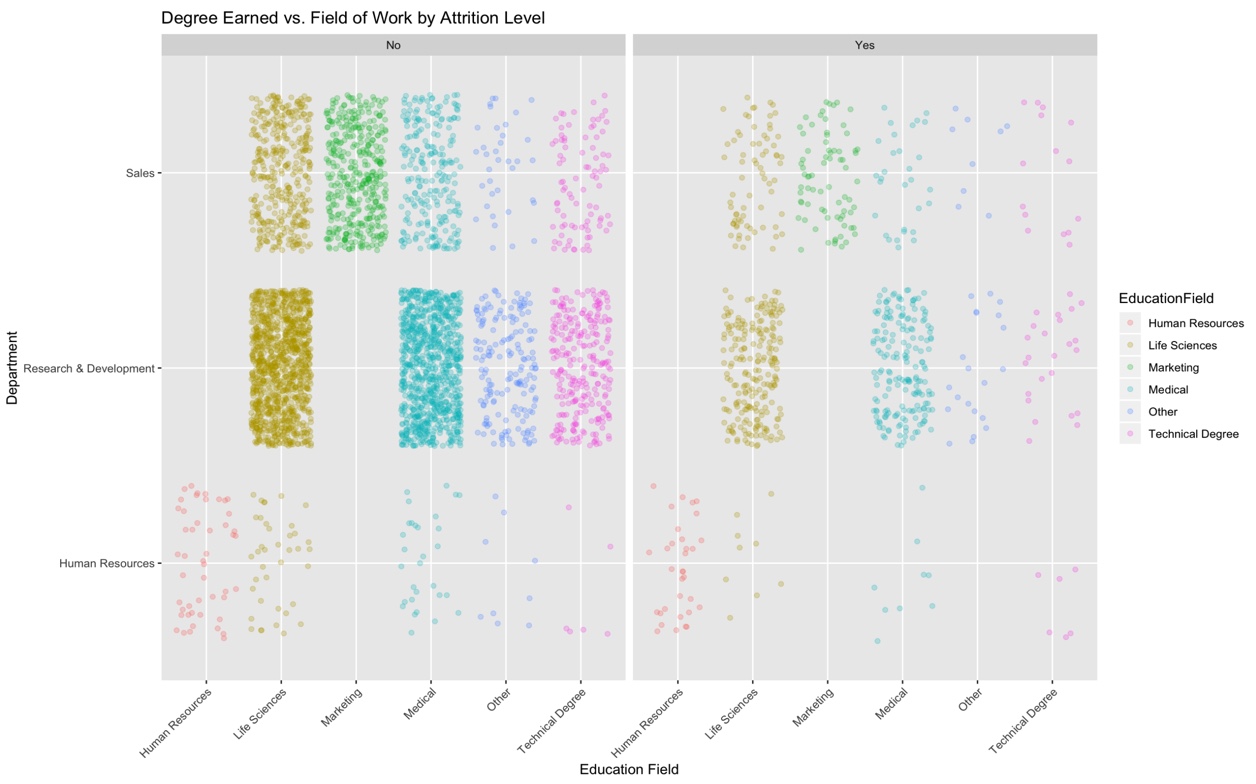
Investigating Staff Turnover using Regression and Machine Learning
Examined survey results to understand workforce attrition and cluster employees based on income level, education field, and other significant variables. Analyzed logistic regression and ten machine learning models to predict turnover with 91% accuracy and proposed improvements to retention and recruiting processes.
No: employee did not leave the company | Yes: employee did leave the company
Forecasting Pollution Levels in Madrid using ARIMA Modeling
Fit and fine-tuned ARIMA models to consider trend and seasonality to better forecast air quality levels. Validated prediction performance against actual levels with 80% accuracy.
Parsing Doctors’ Notes
In this project I used text processing techniques and metrics like term frequency-inverse document frequency to gather descriptive statistics and distinguish important words from notes. I looked into questions like “What percentage of notes that mention ‘depression’ also mention ‘pain’?” and vice versa.